Archive for May, 2012
Anaheim Hills Statistics – May 25,2012
If you would like to search the MLS the same way I do, email me at LesslieG@aol.com
The following statistics include real estate transactions for Anaheim Hills as of Friday, May 25, 2012.
Condo Listings, by Zip Code, Activity between 5/18/12-5/25/12
Active condo listings in 92807:
7, Average price is $362,557; 1,551 square feet or $233.76 per square foot.
Pending:
1, $469,900; 2,000 square feet or $234.95 per square foot.
No Backup or Closed Sales between 5/18/12-5/25/12
Active condo listings in 92808:
11, Average price is $327,018; 1,183 square feet or $276.43 per square foot.
Back-up:
3, Average price is $275,666; 1,061 square feet or $259.82 per square foot.
No Pending or Closed sales between 5/18/12-5/25/12
Single Family Residence Listings, By Zip Code, Activity between 5/18/12-5/25/12
Active SFR listings in 92807:
51, ranging from $418,900 for 2,348 square feet to $3,899,000 for 10,000 square feet.
Back-up:
2, Average price is $634,500; 2,685 square feet or $236.31 per square foot.
Pending:
3, Average price is $588,600; 2,788 square feet or $211.12 per square foot.
Closed:
3, Average price is $761,000; 3,016 square feet or $252.32 per square foot.
Active SFR listings in 92808:
42, ranging from $399,500 for 1,430 square feet to $3,000,000 for 6,118 square feet.
Back-up:
2, Average price is $597,500; 2,368 square feet or $252.32 per square foot.
Pending:
3, Average price is $549,666; 2,231 square feet or $246.38 per square foot.
Closed:
1, $520,000; 1,850 square feet or $281.08 per square foot.
April 2012 Market Summary
Orange County:
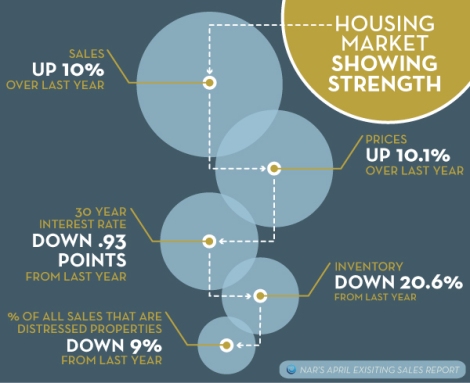
• Comparing April, year over year, pended sales up 51.9% over a year ago, homes available for buyers, down 56.8%
• Closings were up 16.2% over a year ago
• The effect of fewer listings and more pended sales is clearly illustrated in the Months of Inventory/ Closed Sales (2.3 months) and Months of Inventory/Pended Sales (1.5 months)
• Compared to a year ago, the average price per square foot is virtually unchanged at $290
• The sold/list differential percentage is slightly improved over one year ago. The 3% figure represents how buyers and seller are negotiating with each other as well it tells us how buyers and sellers should strategize to list their property and how to strategize writing an offer to obtain the best results.
• Overall, supply is decreasing dramatically and pended sales have increased significantly. The trajectory, if the current trend continues we expect a flattening of prices and in some local markets, even appreciation. Overall, in April there were 7,825 fewer homes available and 1,371 more homes sold in April 2012 than April 2011. Overall in Orange County, 2/3 of the supply of homes sold in April 2012 with prices per square foot remaining somewhat flat and less than April 2011.
Anaheim Hills 92807:
• Comparing April 2012 to April 2011, pended sales are up 17.4%, while homes available are down 51.2%
• Closings were up 16.7% over a year ago
• Months of Inventory/Closings (2.4 months) and Months of Inventory/Pended Sales (1.5 months) indicate a low supply and high demand
• The average price per square foot has increased from a year ago from $237 to $242
• The sold/list price differential is 3%
Anaheim Hills 92808:
• Comparing April 2012 to April 2011, pended sales are up 144.4%, while homes available are down 57.2%
• Closings were up 65.2% over a year ago
• Months of Inventory/Closings (1.6 months) and Months of Inventory/Pended Sales (1.4 months) indicate a low supply and high demand
• The average price per square foot has decreased from a year ago from $253 to $248
• The sold/list price differential is 1%
Anaheim Hills Statistics – May 11, 2012
If you would like to search the MLS the same way I do, email me at LesslieG@aol.com
The following statistics include real estate transactions for Anaheim Hills as of Friday, May 11, 2012.
Condo Listings, by Zip Code, Activity between 5/4/12-5/11/12
Active condo listings in 92807:
6, Average price is $408,133; 1,740 square feet or $234.56 per square foot.
Closed:
1, $367,500; 1,392 square feet or $264.01 per square foot.
No Backup or Pending Sales between 5/4/12-5/11/12
Active condo listings in 92808:
11, Average price is $308,290; 1,137 square feet or $271.14 per square foot.
Back-up:
1, $318,000; 1,205 square feet or $263.90 per square foot.
No Pending or Closed sales between 5/4/12-5/11/12
Single Family Residence Listings, By Zip Code, Activity between 5/4/12-5/11/12
Active SFR listings in 92807:
46, ranging from $410,000 for 1,572 square feet to $3,899,000 for 10,000 square feet.
Back-up:
5, Average price is $651,000; 2,565 square feet or $253.80 per square foot.
Pending:
1, $1,575,000; 6,087 square feet or $258.75 per square foot.
Closed:
4, Average price is $569,500; 2,460 square feet or $231.50 per square foot.
Active SFR listings in 92808:
33, ranging from $425,000 for 1,432 square feet to $3,000,000 for 6,118 square feet.
Back-up:
4, Average price is $644,975; 2,525 square feet or $255.44 per square foot.
Pending:
4, Average price is $590,975; 2,317 square feet or $255.06 per square foot.
Closed:
3, Average price is $558,316; 2,707 square feet or $206.25 per square foot.